In den Scripts nach "binary option" suchen

BOSS Smooth Stochastic RSI Histogram Oscillator With Alerts THE BEST FOREX, BINARY OPTIONS, AND CRYPTO INDICATORS FOR TRADINGVIEW.COM
Our smooth stochastic rsi in column form with buy and sell alerts.

BOSS Zero-Lag Dynamic MACDTHE BEST FOREX, BINARY OPTIONS, AND CRYPTO INDICATORS FOR TRADINGVIEW.COM
Our MACD is a Zero-Lag (well near zero-lag) We make this claim because MACD utilizes Moving Averages and as you know moving averages are lagging indicators.
For our MACD we utilize The McGinley Dynamic which looks like a moving average line yet it is a smoothing mechanism for prices that turns out to track far better than any moving average.
The McGinley Dynamic minimizes price separation, price whipsaws and hugs prices much more closely.
The McGinley Dynamic does this automatically as this is a factor of the formula.
Because of the calculation, the Dynamic Line speeds up in down markets as it follows prices yet moves more slowly in up markets.
As traders we want to be quick to sell in a down market, yet ride an up market as long as possible.
Source: Investopedia.com
Chart Image shows conventional MACD on Bottom and BOSS Zero-Lag Dynamic MACD on top
Available at: bosscripts.com

BOSS EMA Trend MeterTHE BEST FOREX, BINARY OPTIONS, AND CRYPTO INDICATORS FOR TRADINGVIEW.COM
Bullish Uptrend
To determine bullish uptrend there must beat least 2 green squares on all three trend meters. This is a great predictor that a uptrend is imminent.
Bearish Downtrend
To determine bearish downtrend there must beat least 2 red squares on all three trend meters. This is a great predictor that a downtrend is imminent.
For best results use with Boss Bull/Bear Stochastic RSI
If you get a buy signal on Boss Bull/Bear Stochastic RSI and trend meter has a minimum of 2 green squares then this is a great buy/long entry.
If you get a sell signal on Boss Bull/Bear Stochastic RSI and trend meter has a minimum of 2 red squares then this is a great sell/short entry
Available at bosscripts.com
Website bosscripts.com

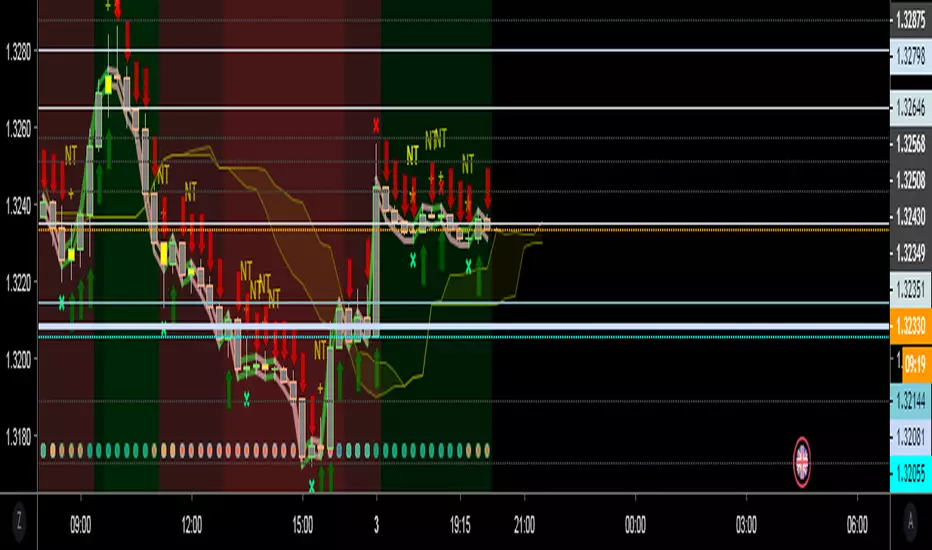
BOSS Smooth Stochastic Bull/Bear Oscillator With Alerts THE BEST FOREX, BINARY OPTIONS, AND CRYPTO INDICATORS FOR TRADINGVIEW.COM
Short Entry
During a price downtrend and you get a sell signal (red dot) enter short when the "K" line (green line) drops below 65 (mid upper band).
Long Entry
During an uptrend, buy when you get a long signal (green dot) and "D" line (red line) rises above 35 (mid lower band) .
Bull/Bear
Green background indicates bullish price action (uptrend)
Red background indicates bearish price action (downtrend)
Available At bosscripts.com
Website bosscripts.com

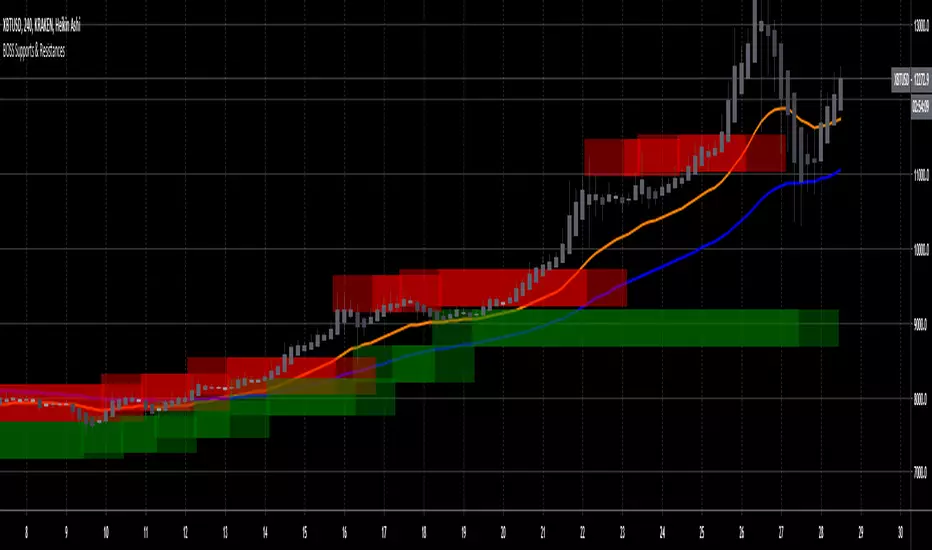
Boss Support and Resistance zonesTHE BEST FOREX, BINARY OPTIONS, AND CRYPTO INDICATORS FOR TRADINGVIEW.COM
Green = Support Zones
Red = Resistance Zones
The basic trading method for using support and resistance is to buy/long near support in uptrends, and to sell/short near resistance in downtrends.
Also included in this indicator are a Higher High, Lower High, Higher Low, and Lower Low indicator as well as Fast and Slow EMA'S
Available at bosscripts.com
Website bosscripts.com
BOSS Automatic TrendlinesTHE BEST FOREX, BINARY OPTIONS, AND CRYPTO INDICATORS FOR TRADINGVIEW.COM
Trendlines when drawn properly make an excellent tool for traders. Used improperly though, they become ineffective and even counterproductive, resulting in a belief that prices have made a reversal when they really haven't, or that a trend has strength when price action suggests it doesn't.
The Boss Auto Trendline Indicator draws the trendlines automatically, and now you can effectively use trendlines as part of your trading strategy.
Trendlines highlight a trend or range (sideways movement). A trendline connects swing lows, where the low is lower than the surrounding prices, and swing highs in price. When the price rises, the swing lows rise.
Red Lines & Dots.
Connecting these lows with a line results in an ascending trendline, showing you that the trend is up. A trendline can also be drawn along the swing highs. This shows the angle of ascent, and the strength of the price move, whether strongly higher or not.
Green Lines & Dots
When the price falls, the swing highs fall. Connecting these highs with a line results in a descending trendline, illustrating the downward trend. A trendline can also be drawn along the swing lows. This shows the angle of descent and the strength of the downward price movement.
Available at bosscripts.com
Website bosscripts.com

Graph Reader Pro 5.0Graph Reader Pro 5.0 for TradingView gives you abilities to see the stories hiding in the graphs of the stock, forex, and crypto currency markets. It counts CC59 and creates respectable support and resistance levels as well as marks and reminds you about important parameters that are happening in the graph so that you will not forget to consider them before placing orders. These parameters include:
Automatic CC59 counting that compares the close of the right price bar to that of left price bar in a group of 5 consecutive bars (ignoring 3 bars in the middle). If the right bar closed higher, the count positive number would be printed above the bar. If the right bar closed lower, the count negative number would be printed below the bar. Nine consecutive series of up counts will define the lowest price as CC59 support line and nine consecutive series of down counts will define the highest price as CC59 resistance line. The counted numbers, support and resistance lines are automatically printed on the graph if enabled.
Draw the high and low levels of the previous day, if enabled. The Previous Day's High and Low are often used as reversal levels in the few future days.
Draw the price range of each day based on Average Daily Range (ADR) value. These lines only show in graphs with less than daily time frames.
Draw the price range of each week based on Average Weekly Range (AWR) value. These lines only show in daily graphs.
Draw simple moving average line SMA3 (yellow), SMA13 (green), SMA50 (pink), and SMA200 (white).
Draw Bollinger bands (50,2) upper and lower lines (pink) with SMA50 as a center line (pink).
Locate the price gaps in the graphs of stocks and indexes. The opened gaps are often closed later on. Hence, they are milestones for the price to come back and close them up.
Paint the background areas with active Forex trading of Asian, London, and New York sessions, if enabled.
Locate an engulfing bar that cover the previous bar with a body portion less than 50% of its range.
Locate an anchor bar that has the range (High - Low) larger than those 14 bars earlier.
Print "RSI>70" and "RSI<70" for RSI(14) that crossed above 70 % and below 70 %.
Print "RSI<30" and "RSI>30" for RSI(14) that crossed below 30 % and above 30 %.
Print "MACD>Sig" and "MACD0" and "MACD<0" for MACD(12,26,9) that crossed above and below zero.
Print "Max" and "Min" for local maximum and local minimum bars.
Print "MA3>13>50" and "MA3<13<50" for ordering of SMA(3,13,50).
Create alarm conditions for the following events that could be set to notify the investor on screen, to an email and to a smart phone:
"Close above MA3"
"Close under MA3"
"Close above MA13"
"Close under MA13"
"Close above MA50"
"Close under MA50"
"Close above MA200"
"Close under MA200"
"MACD up"
"MACD down"
"MACD>Sig"
"MACD0"
"MACD<0"
"MA3 up"
"MA3 down"
"MA13 up"
"MA13 down"
"MA50 up"
"MA50 down"
"CC59 = -1"
"CC59 = +1"
"CC59 = -9"
"CC59 = +9"
"CC59 = -9F"
"CC59 = +9F"
"MA3 < MA13"
"MA3 > MA13"
"MA13 < MA50"
"MA13 > MA50"
"(MA3 < MA13) > MA50"
"MA50 > (MA3 > MA13)"
"MA3 > MA13 > MA50"
"MA3 < MA13 < MA50"
"RSI<30"
"RSI>30"
"RSI<50"
"RSI>50"
"RSI<70"
"RSI>70"
"Hit yesterday's high"
"Hit yesterday's low"
"Hit day open + ADR/2"
"Hit day open"
"Hit day open - ADR/2"
"Hit CC59 resistance"
"Hit CC59 support"
=================================================================================================
The source code of Graph Reader Pro 5.0 custom indicator is protected.
Only invited TradingView members can apply this indicator to their forex, crypto currency and stock price graphs.
Lifetime invitation is for 100 USD with free future upgrades and online supports.
Rental invitation is for 10 USD/month with free future upgrades and online supports.
Paypal, Bank transfer and Bitcoin payments are welcome.
For more informaton please contact the author (DrGraph or Nimit Chomnawang, PhD) via TradingView private chat
or in the comment field below.
=================================================================================================
How to install the script:
------------------------------
*Go to the bottom of this page and click on "Add to Favorite Scripts".
*Remove older version Graph Reader Pro by clicking on the "X" botton behind the indicator line at the top left corner of the chart window.
*Open a new chart at and click on the "Indicators" tab.
*Click on the "Favorites" tab and choose "Graph Reader Pro 5.0".
*Right click anywhere on the graph, choose "Settings".
*In "Style" tab, choose the Dark Theme.
*In "Scales" tab, select Decimal Places = 1/100000.
*In "Background" tab, uncheck "Indicator Arguments" and "Indicator Values".
*In "Timezone/Sessions" tab, choose Time Zone = Your local time.
*At the bottom of settings window, click on "Template", "Save As...", then name this theme of graph setting for future call up such as "Graph Reader Pro".
*Click OK.
*Right click anywhere on the graph, choose "Color Theme => Dark".
For free TradingView plan, you can add two more indicators to the chart. That means you may add RSI and MACD indicators with same parameters as those setup in Graph Reader Pro to your graph. DrGraph regularly publishes his educational ideas on using features provided in Graph Reader Pro for profitable investments. You can follow him for how to use the tools in trading stocks, forex, and binary options.

Graph Reader Pro 4.0Graph Reader Pro 4.0 for TradingView gives you abilities to see the stories hiding in the graphs of the stock, forex, and crypto currency markets. It counts CC59 and creates respectable support and resistance levels as well as marks and reminds you about important parameters that are happening in the graph so that you will not forget to consider them before placing orders. These parameters include:
Automatic CC59 counting that compares the close of the right price bar to that of left price bar in a group of 5 consecutive bars (ignoring 3 bars in the middle). If the right bar closed higher, the count positive number would be printed above the bar. If the right bar closed lower, the count negative number would be printed below the bar. Nine consecutive series of up counts will define the lowest price as CC59 support line and nine consecutive series of down counts will define the highest price as CC59 resistance line. The counted numbers, support and resistance lines are automatically printed on the graph if enabled.
Draw the high and low levels of the previous day, if enabled. The Previous Day's High and Low are often used as reversal levels in the few future days.
Draw the price range of each day based on Average Daily Range (ADR) value. These lines only show in graphs with less than daily time frames.
Draw the price range of each week based on Average Weekly Range (AWR) value. These lines only show in daily graphs.
Draw simple moving average line SMA3, with ability to change the line color based on increasing or decreasing MACD value.
Draw simple moving average line SMA50, with ability to change the line color based on its own increasing or decreasing value.
Locate the price gaps in the graphs of stocks and indexes. The opened gaps are often closed later on. Hence, they are milestones for the price to come back and close them up.
Draw a ribbon of simple moving average lines consisting of SMA3, SMA4, SMA5, SMA6 and SMA7, if enabled. Twisting of the SMA ribbon gives a visual signal for price reversal.
Draw a set of other simple moving average lines such as SMA13, SMA200, SMA800 (if enabled).
Paint the background areas with active Forex trading of Asian, London, and New York sessions, if enabled.
Locate an engulfing bar that cover the previous bar with a body portion less than 50% of its range.
Locate an anchor bar that has the range (High - Low) larger than those 14 bars earlier.
Print "RSI>70" and "RSI<70" for RSI(14) that crossed above 70 % and below 70 %.
Print "RSI<30" and "RSI>30" for RSI(14) that crossed below 30 % and above 30 %.
Print "RSI<50" and "RSI>50" for RSI(14) that crossed below 50 % and above 50 %.
Print "MACD>Sig" and "MACD0" and "MACD<0" for MACD(12,26,9) that crossed above and below zero.
Print "Max" and "Min" for local maximum and local minimum bars.
Print "SMA5>13" and "SMA5<13" for SMA(5) crossed above and below SMA(13).
Print "Highest" and "Lowest" at the highest and lowest prices in a group of configurable number of bars earlier.
=================================================================================================
The source code of Graph Reader Pro 4.0 custom indicator is protected.
Only invited TradingView members can apply this indicator to their forex, crypto currency and stock price graphs.
Lifetime invitation is for 100 USD with free future upgrades and online supports.
Rental invitation is for 10 USD/month with free future upgrades and online supports.
Paypal, Bank transfer and Bitcoin payments are welcome.
For more informaton please contact the author (DrGraph or Nimit Chomnawang, PhD) via TradingView private chat
or in the comment field below.
=================================================================================================
How to install the script:
------------------------------
*Go to the bottom of this page and click on "Add to Favorite Scripts".
*Remove older version Graph Reader Pro by clicking on the "X" botton behind the indicator line at the top left corner of the chart window.
*Open a new chart at and click on the "Indicators" tab.
*Click on the "Favorites" tab and choose "Graph Reader Pro 4.0".
*Right click anywhere on the graph, choose "Settings".
*In "Style" tab, choose the Dark Theme.
*In "Scales" tab, select Decimal Places = 1/100000.
*In "Background" tab, uncheck "Indicator Arguments" and "Indicator Values".
*In "Timezone/Sessions" tab, choose Time Zone = Your local time.
*At the bottom of settings window, click on "Template", "Save As...", then name this theme of graph setting for future call up such as "Graph Reader Pro".
*Click OK.
For free TradingView plan, you can add two more indicators to the chart. That means you may add RSI and MACD indicators with same parameters as those setup in Graph Reader Pro to your graph. DrGraph regularly publishes his educational ideas on using features provided in Graph Reader Pro for profitable investments. You can follow him for how to use the tools in trading stocks, forex, and binary options.

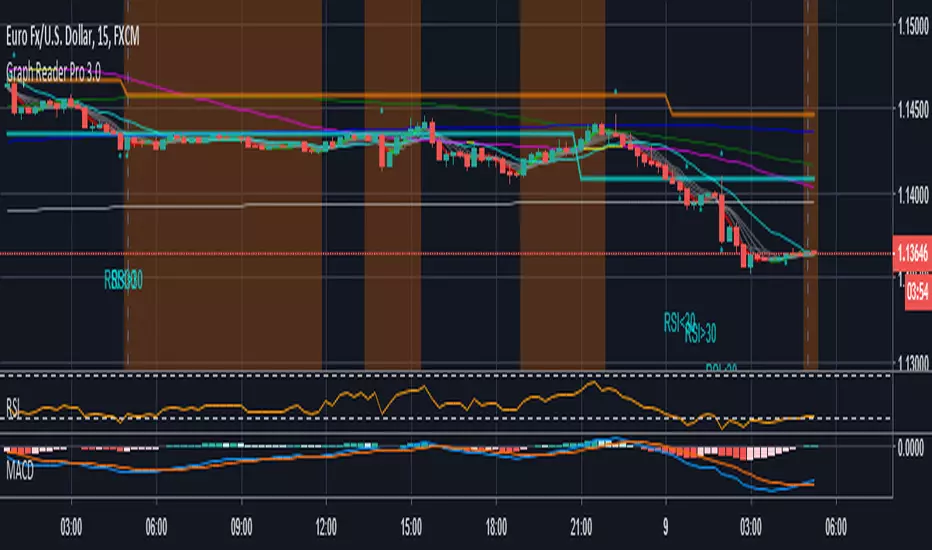
Graph Reader Pro 3.0Graph Reader Pro 3.0 for TradingView gives you abilities to see the stories hiding in the graphs of the stock, forex, and crypto currency markets. It counts CC59 and creates respectable support and resistance levels as well as marks and reminds you about important parameters that are happening in the graph so that you will not forget to consider them before placing orders. These parameters include:
Automatic CC59 counting that compares the close of the right price bar to that of left price bar in a group of 5 consecutive bars (ignoring 3 bars in the middle). If the right bar closed higher, the count positive number would be printed above the bar. If the right bar closed lower, the count negative number would be printed below the bar. Nine consecutive series of up counts will define the lowest price as CC59 support line and nine consecutive series of down counts will define the highest price as CC59 resistance line. The counted numbers, support and resistance lines are automatically printed on the graph if enabled.
Draw the high and low levels of the previous day, if enabled. The Previous Day's High and Low are often used as reversal levels in the few future days.
Draw the price range of each day based on Average Daily Range (ADR) value.
Draw the price range of each week based on Average Weekly Range (AWR) value.
Paint the background areas with active Forex trading of Asian, London, and New York sessions, if enabled.
Draw simple moving average lines such as SMA3, with ability to change the line color based on increasing or decreasing MACD value.
Draw simple moving average lines such as SMA50 with ability to change the line color based on increasing or decreasing prices. A set of other simple moving average lines such as SMA13, SMA200, SMA800 can be drawn if enabled.
Draw a ribbon of simple moving average lines consisting of SMA3, SMA4, SMA5, SMA6 and SMA7, if enabled. Twisting of the SMA ribbon gives a visual signal for price reversal.
Locate the price gaps in the graphs of stocks and indexes. The opened gaps are often closed later on. Hence, they are milestones for the price to come back and close them up.
Locate the pin bars having the body portion less than a specific percent of the range. The pin bars show hestitation for the price to continue the current trend. When a pin bar is covered or engulfed by the next larger bar, a trend reversal offen follows.
Automatic printing of the events happening in the graph to remind the readers of parameters under considerations (if enabled) including:
- Print "C>SMA3" and "C13" and "SMA5<13" for SMA(5) crossed above and below SMA(13).
- Print "Max" and "Min" for local maximum and local minimum bars.
- Print "RSI>70" and "RSI<70" for RSI(14) that crossed above 70 % and below 70 %.
- Print "RSI<30" and "RSI>30" for RSI(14) that crossed below 30 % and above 30 %.
- Print "RSI>50" and "RSI<50" for RSI(14) that crossed above 50 % and below 50 %.
- Print "RSI<50" and "RSI>50" for RSI(14) that crossed below 50 % and above 50 %.
- Print "MACD>0" and "MACD<0" for MACD(12,26,9) that crossed above and below zero.
- Print "MACD>Sig" and "MACD
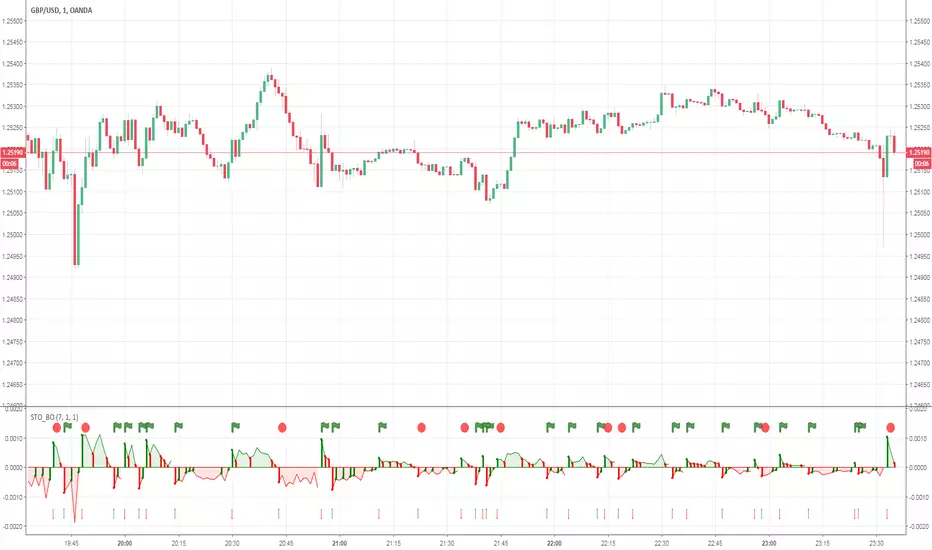
BinaryLifeThe indicator shows market entry points for binary options. The optimal timeframe is 3 minutes. Expiration of trades depending on currency pairs (3, 6 minutes). Each pair is selected according to history, what is the expiration better. It gives signals on the trend of higher timeframes.
/////////
Индикатор показывает точки входа в рынок для бинарных опционов. Оптимальный таймфрейм является 3 минуты. Экспирация сделок в зависимости от валютных пар (3, 6 минут). Каждая пара подбирается по истории, какая экспирация лучше. Дает сигналы по тренду старших таймфреймов.

Graph Reader Pro 2.0Graph Reader Pro 2.0 for TradingView gives you abilities to see the stories hiding in the graphs of the stock, forex, and crypto currency markets. It counts CC59 and creates respectable support and resistance levels as well as marks and reminds you about important parameters that are happening in the graph so that you will not forget to consider them before placing orders. These parameters include:
Automatic CC59 counting that compares the close of the right price bar to that of left price bar in a group of 5 consecutive bars (ignoring 3 bars in the middle). If the right bar closed higher, the count positive number would be printed above the bar. If the right bar closed lower, the count negative number would be printed below the bar. Nine consecutive series of up counts will define the lowest price as CC59 support line and nine consecutive series of down counts will define the highest price as CC59 resistance line. The counted numbers, support and resistance lines are automatically printed on the graph if enabled.
Draw the high and low levels of the previous day, if enabled. The Previous Day's High and Low are often used as reversal levels in the few future days.
Draw the price range of each day based on Average Daily Range (ADR) value.
Paint the background areas with active Forex trading of Asian, London, and New York sessions, if enabled.
Draw simple moving average lines such as SMA5, SMA50 with ability to change the line color based on increasing or decreasing prices. A set of other simple moving average lines such as SMA13, SMA200, SMA800 can be drawn if enabled.
Draw a ribbon of simple moving average lines consisting of SMA3, SMA4, SMA6 and SMA7, if enabled. Twisting of the SMA ribbon gives a visual signal for price reversal.
Locate the price gaps in the graphs of stocks and indexes. The opened gaps are often closed later on. Hence, they are milestones for the price to come back and close them up.
Locate the pin bars having the body portion less than a specific percent of the range. The pin bars show hestitation for the price to continue the current trend. When a pin bar is covered or engulfed by the next larger bar, a trend reversal offen follows.
Draw Bollinger bands (50,2), if enabled.
Automatic printing of the events happening in the graph to remind the readers of parameters under considerations (if enabled) including:
- Print "C>SMA5" and "C13" and "SMA5<13" for SMA(5) crossed above and below SMA(13).
- Print "Max" and "Min" for local maximum and local minimum bars.
- Print "RSI>70" and "RSI<70" for RSI(14) that crossed above 70 % and below 70 %.
- Print "RSI<30" and "RSI>30" for RSI(14) that crossed below 30 % and above 30 %.
- Print "MACD>0" and "MACD<0" for MACD(12,26,9) that crossed above and below zero.
- Print "MACD>Sig" and "MACD

Graph Reader Pro 1.0Graph Reader Pro 1.0 for TradingView gives you abilities to see the stories hiding in the graphs of the stock, forex, and crypto currency markets. It counts CC59 and creates respectable support and resistance levels as well as marks and reminds you about important parameters that are happening in the graph so that you will not forget to consider them before placing orders. These parameters include:
Automatic CC59 counting that compares the close of the right price bar to that of left price bar in a group of 5 consecutive bars (ignoring 3 bars in the middle). If the right bar closed higher, the count positive number would be printed above the bar. If the right bar closed lower, the count negative number would be printed below the bar. Nine consecutive series of up counts will define the lowest price as CC59 support line and nine consecutive series of down counts will define the highest price as CC59 resistance line. The counted numbers, support and resistance lines are automatically printed on the graph if enabled.
Draw simple moving average lines such as SMA5, SMA50 with ability to change the line color based on increasing or decreasing prices. A set of other simple moving average lines such as SMA13, SMA200, SMA800 can be drawn if enabled.
Draw a ribbon of simple moving average lines consisting of SMA2, SMA3, SMA4, SMA6, SMA7 and SMA8, if enabled. Twisting of the SMA ribbon gives a visual signal for price reversal.
Find the locations of price gaps.
Draw Bollinger bands (50,2), if enabled.
Draw the high and low levels of the previous day, if enabled.
Paint the background areas with active Forex trading of Asian, London, and New York sessions, if enabled.
Automatic printing of the events happening in the graph to remind the readers of parameters under considerations (if enabled) including:
- Print "C>SMA5" and "C13" and "SMA5<13" for SMA(5) crossed above and below SMA(13).
- Print "SMA5>50" and "SMA5<50" for SMA(5) crossed above and below SMA(50).
- Print "SMA50>200" and SMA50<200" for SMA(50) crossed above and below SMA(200).
- Print "Max" and "Min" for local maximum and local minimum bars.
- Print "RSI>70" and "RSI<70" for RSI(14) that crossed above 70 % and below 70 %.
- Print "RSI<30" and "RSI>30" for RSI(14) that crossed below 30 % and above 30 %.
- Print "MACD>0" and "MACD<0" for MACD(12,26,9) that crossed above and below zero.
- Print "MACD>Sig" and "MACD

Forex Insight Pro 8.0Forex Insight Pro 8.0 for TradingView gives you abilities to see the stories hiding in the graphs of the stock, forex, and crypto currency markets. It counts CC59 and creates respectable support and resistance levels as well as marks and reminds you about important parameters that are happening on the graph so that you will not forget to consider them before placing orders. These parameters include:
Automatic cc59 counting that compares the close of the right price bar to that of left price bar in a group of 5 consecutive bars (ignoring 3 bars in the middle). If the right bar closed higher, the count positive number would be printed above the bar. If the left bar closed higher, the count negative number would be printed below the bar. Nine consecutive series of up counts will define the lowest price as cc59 support line and nine consecutive series of down counts will define the highest price as cc59 resistance line. The count numbers and support / resistance lines are automatically printed on the graph if enabled.
Draw a set of simple moving average lines such as SMA5, SMA13, SMA50, SMA200, SMA800, if enabled.
Draw a ribbon of simple moving average lines consisting of SMA2, SMA3, SMA4, SMA6, SMA7, SMA8, and SMA9, if enabled. Twisting of the SMA ribbon gives a visual signal for price reversal.
Draw Bollinger bands (50,2), if enabled.
The color of SMA5 line can be set to change based on increasing/decreasing values of itself.
The color of SMA50 line (which is the same as the the middle line of Bollinger band (50,2) ) can be set to change based on increasing/decreasing values of itself, or of the MACD(12,26,9).
Draw the high and low levels of the previous day, if enabled.
Paint the background areas with active forex trading of Asian, London, and New York sessions, if enabled.
Automatic printing of the events happening in the graph to remind the readers of parameters under considerations (if enabled) including:
- Print "SMA5>13" and "SMA5<13" for SMA5 crossed above and below SMA13.
- Print "SMA50>200" and SMA50<200" for SMA50 crossed above and below SMA200.
- Print "Max" and "Min" for local maximum and local minimum bars.
- Print "C75" and "C25" for the bars that closed above 75% and closed below 25% of its ranges.
- Print "C>SMA50" and "C3" and "SMA2<3" for SMA2 crossed above and below SMA3.
- Print "RSI>30" and "RSI<70" for RSI(14) that crossed above 30 % and below 70 %.
- Print "MACD>0" and "MACD<0" for MACD(12,26,9) that crossed above and below zero.
- Print "MACD>Sig" and "MACD

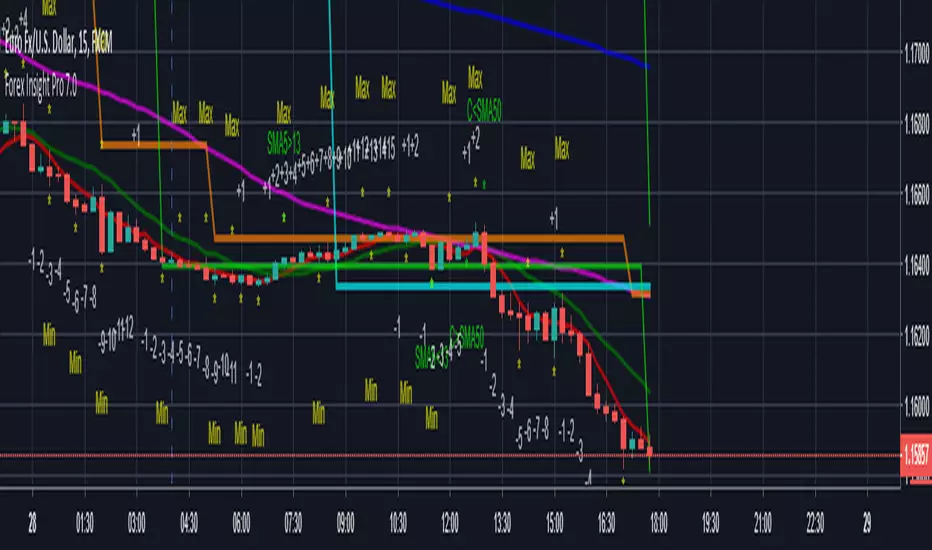
Forex Insight Pro 7.0Forex Insight Pro 7.0 for TradingView gives you abilities to see the stories hiding in the graphs of the markets. It marks and reminds you about important parameters that are happening on the graph so that you will not forget to consider them before placing orders. These parameters include:
Automatic CC(X) counting that compare the close of the right price bar to that of left price bar in a group of X consecutive bars such as CC(5,9) of a group of 5 bars will compare the close price of the right bar to the left bar (ignoring 3 bars in the middle). If the right bar closed higher, the count positive number would be printed above the bar. If the left bar closed higher, the count negative number would be printed below the bar. Nine consecutive series of up counts will define the lowest price as CC(5,9) support line and nine consecutive series of down counts will define the highest price as CC(5,9) resistance line. The count numbers and support / resistance lines are automatically printed on the graph if enabled.
Show a set of simple moving average lines such as SMA5, SMA13, SMA50, SMA200, SMA800, if enabled. The color of SMA50 line (which is the same as the the middle line of Bollinger band (50,2) can be set to change based on increasing/decreasing values of itself, or of the MACD(12,26,9).
Show Bollinger bands (50,2), if enabled.
Show the high and low levels of the previous day, if enabled.
Show the important time areas for Forex trading during Asian, London, and New York sessions, if enabled.
Automatic printing of the events happening in the graph to remind the readers of parameters under considerations (if enabled) including:
- Print "SMA5>13" and "SMA5<13" for SMA5 crossed above and below SMA13.
- Print "SMA50>200" and SMA50<200" for SMA50 crossed above and below SMA200.
- Print "Max" and "Min" for local maximum and local minimum bars.
- Print "C75" and "C25" for the bars that closed above 75% and closed below 25% of its ranges.
- Print "C>SMA50" and "C30" and "RSI<70" for RSI(14) that crossed above 30 % and below 70 %.
- Print "MACD>0" and "MACD<0" for MACD(12,26,9) that crossed above and below zero.
- Print "MACD>Sig" and "MACD
Dominus_Option_v_2.0This indicator is designed for trading on the binary options market. The timeframe for use of any (more signals gives a timeframe M1, M5 in a day you get about 5-7 signals per day). When trading on M1 signal is issued for 10-60 seconds before the opening of the transaction. In the indicator settings exhibited the expiration time of the transaction. The green bar indicates a successful transaction, the red one indicates a losing transaction. Priority currency pair EUR USD.
/////////
Данный индикатор предназначен для торговли на рынке бинарных опционов. Таймфрейм для использования любой (больше сигналов выдает таймфрейм М1, на М5 в день выдается около 5-7 сигналов за день). При торговле на М1 сигнал выдается за 10-60 секунд до открытия сделки. В настройках индикатора выставляется срок экспирации сделки. Зеленая полоса свидетельствует об успешной сделке, красная об убыточной сделке. Приоритетная валютная пара EURUSD.

Forex Insight Pro 6.0Forex Insight Pro 6.0 for TradingView gives you abilities to see the stories hiding in the graphs of the markets. It marks and reminds you about important parameters that are happening on the graph so that you will not forget to consider them before placing orders. These parameters include:
Automatic CC(X) counting that compare the close of the right price bar to that of left price bar in a group of X consecutive bars such as CC(5,9) of a group of 5 bars will compare the close price of the right bar to the left bar (ignoring 3 bars in the middle). If the right bar closed higher, the count number would be printed above the bar. If the left bar closed higher, the count number would be printed below the bar. Nine consecutive series of up counts will define the lowest price as CC(5,9) support line and nine consecutive series of down counts will define the highest price as CC(5,9) resistance line. The count numbers and support / resistance lines are automatically printed on the graph if enabled.
Show a set of simple moving average lines such as SMA5, SMA13, SMA50, SMA200, SMA800, if enabled. The color of SMA50 line (which is the same as the the middle line of Bollinger band (50,2) can be set to change based on increasing/decreasing values of itself, or of the MACD(12,26,9).
Show Bollinger bands (50,2), if enabled.
Show the high and low levels of the previous day, if enabled.
Show the important time areas for Forex trading during Asian, London, and New York sessions, if enabled.
Automatic printing of the events happening in the graph to remind the readers of parameters under considerations (if enabled) including:
- Print "SMA5>13" and "SMA5<13" for SMA5 crossed above and below SMA13.
- Print "SMA50>200" and SMA50<200" for SMA50 crossed above and below SMA200.
- Print "Max" and "Min" for local maximum and local minimum bars.
- Print "C75" and "C25" for the bars that closed above 75% and closed below 25% of its ranges.
- Print "C>SMA5" and "C30" and "RSI<70" for RSI(14) that crossed above 30 % and below 70 %.
- Print "MACD>0" and "MACD<0" for MACD(12,26,9) that crossed above and below zero.
- Print "MACD>Sig" and "MACD

Bollinger Bands Strategy LingsbordIndicator made by the idea provided by Lingsbord from the forum Binary Options Edge.
Features Implemented from Original Idea
Trade Sessions 0410-0815 and 0930-1200 (for some reason pinescript works off UTC-4?, London is UTC+1)
Indicator only signals when bar is inside trade sessions.
Background is shaded when Trade session is active.
Indicator Draws Arrows when a bar closes outside of 2.5 bollinger band.
Trade is executed at the opening of the next bar and recorded in the strategy tester.
Modifications to Original Idea
This Strategy has been modified to include his "Anti-Breakout Protection) where it will only place 2 consecutive losing trades in the event of consecutive bar closing outside of the bollingerbands.
www.binaryoptionsedge.com
In the Event of the first trade ending ITM and the next bar closing back inside the Bollinger bands then the next bar going back outside, the script will trigger another trade signal.
Allows for consecutive wins in an uptrend but still limiting to 2 losses as per modification above
Excel Spread sheet tracking profits
$1887.04 from Monday 17-09-2018 to Friday 21-09-2018
i.imgur.com
www.binaryoptionsedge.com
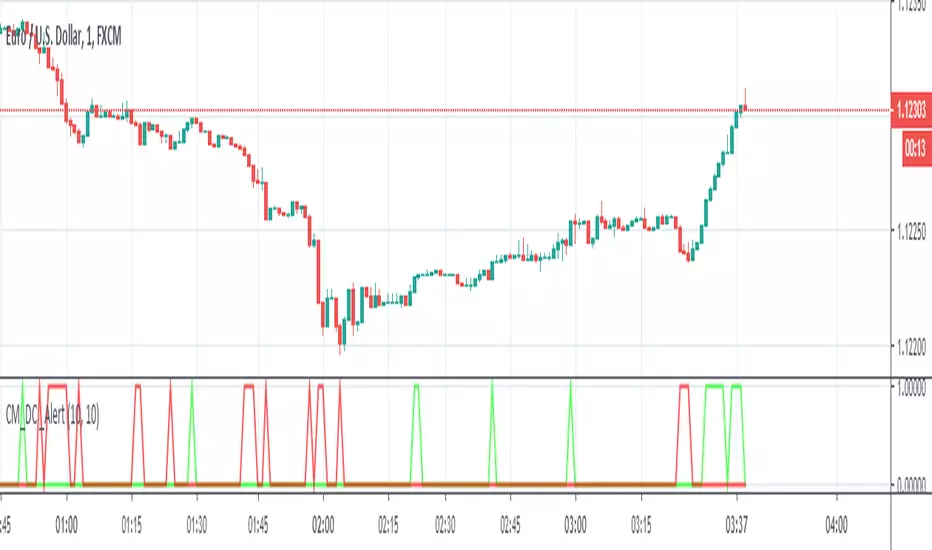
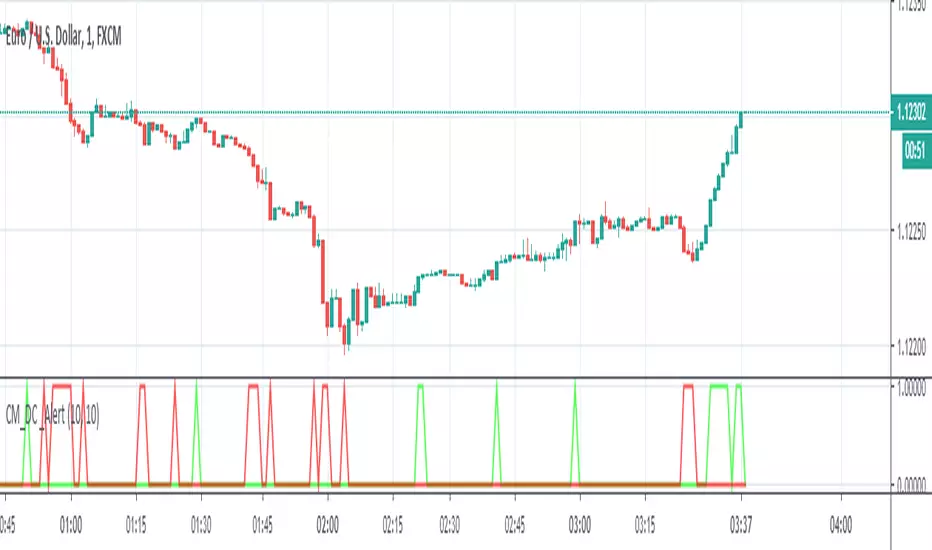
Step 1.
I have an FXCM demo account running Metatrader 4 and a 1 min EURUSD chart open.
This chart has 1 indicator on it, Bollinger Bands with settings 20 and 2.5.
I found that deviation of 2 creates too many false signals and deviation of 3 means you’ll be lucky to see more than 3 trades per day.
I settled on 1 minute for the number of trades it offers during an average day and because the 5 minute offers no better ITM rate.
I also have the Market Watch window open on the metatrader but I reduce the size of the box down so I can only see the EURUSD rate and the clock.
It’s this clock that I use as my “countdown trigger”.
Step 2.
-Redacted- (Affilliate marketing bullshit) -Redacted-
Step 3.
OK as you will have seen elsewhere on the BOE Boards,
the trading strategy is simply to take a trade in the opposite direction when a candle closes outside the Bollinger Bands,
so if it closes out of the top band I enter a Put, and if it closes below the bottom band I enter a Call.
As the Market Watch clock gets into the 50s on the seconds and if a trade appears to be lining up,
I’ll hover over the Put/Call button and closely watch the clock and the chart so I can nail the trade the moment the candle closes.
Expiry is 1 minute.
Trading times
I avoid the period prior to London Open as there’s often a series of trades in the same (wrong) direction as the market gears itself up for the day,
so I’ll normally look for the first trade from 09:10 UK time and I’ll then trade until about 13:15,
picking up again around 14:30 after NYC Open to avoid another rush around that time and to give me a chance to enjoy some lunch without worrying about trading!
For those of you trading Asian markets I’d avoid the “dead zone” and trade from about 02:00 onwards (again, UK time) when there might be enough movement to be able to make sense of this strategy.
Trade sizes
My first trade is $100. If this trade ends ITM I make $82 and look for the next one, again at the starting level of $100
If the first trade ends OTM then my second trade on the next signal is $320. If this trade ends ITM I make $262 which recovers the original $100,
also creates the original $82 of profit that the first trade would have made, and then makes a further $80.
Again your next trade is at the starting level of $100
If the second trade ends OTM then the third trade is $512.
If this trade ends ITM then it recovers the original $100 and the $320 but there’s no profit,
we’ve just recovered the losses and we move on with the next trade at $100
If the third trade ends OTM we REPEAT the $512 trade. If this trade ends ITM we generate $420 towards recovering part of the losses made in the other trades.
These 1-4 trade sequences we call “events”.
Most events will be only 1 or 2 trades,
i.e. you will be making consistent strong returns most of the time.
When an event consists of 3 consecutive trades you will break even on that event and look for the next trade
When an event consists of 4 trades where the 4th one ends ITM you will subsidise your loss on the previous 3.
Some people can’t face the concept of a trade that doesn’t generate profit,
but believe me I’ve run so many examples that this structure works best in terms of risk/reward over time.
When an event consists of 4 trades and the 4th one ends OTM you will take a “hit”.
Based on the above numbers the hit will cost you $1,444 at this level.
When this happens you set the platform back to $100 and start again.
